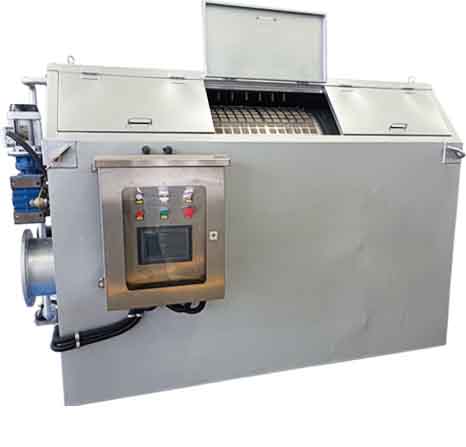
How to calculate hydraulic loading, screen area, and mesh size for a rotary drum filter that actually fits your flow.
Most drum filter sizing requests start the wrong way. Someone asks for “a drum filter for 500 m³/day” without mentioning solids concentration, particle size, or peak flow ratios. That number alone tells a vendor almost nothing useful. Drum filter sizing wastewater projects need solids loading data, not just average daily flow.
This guide walks through the calculation method we use internally. It covers hydraulic loading rate, screen area, and mesh selection. It also covers the safety factors that separate a unit that runs clean from one that blinds within six months. The math is straightforward. The judgment calls around peak flow and fouling tendency are where projects actually go wrong.
We’ll also flag the assumptions vendors quietly build into their sizing software. Some of those assumptions are reasonable. Others assume ideal influent that your site will never deliver. For broader context on filtration technology selection, the Water Environment Federation publishes technical resources worth checking before you commit to a spec.
- Typical hydraulic loading rate: 80–150 m³/m²/h for fine mesh (40–100 micron)
- Coarse mesh loading rate: 150–300 m³/m²/h (200–500 micron)
- Standard mesh sizes: 20, 40, 60, 100, 200, 500 micron
- Recommended safety factor: 1.3–1.5x average daily flow
- Peak flow factor (municipal): typically 2.0–3.0x average dry weather flow
- Drum rotation speed range: 0.5–5 rpm, variable frequency drive standard
- Typical solids removal efficiency: 40–80% TSS depending on mesh size
- Backwash water usage: 1–3% of treated flow
- Submergence depth: usually 1/3 to 1/2 of drum diameter
- Minimum freeboard requirement: 150–200 mm above maximum water level
Step 1: Establish the Real Flow Profile
Average daily flow is the starting point, not the design point. A municipal plant with 2,000 m³/day average might see 4,500 m³/day during a storm event. Industrial sites often have batch discharges that spike flow for two hours and drop to near-zero overnight. Drum filter sizing wastewater calculations that ignore this pattern produce units that overflow during exactly the periods when filtration matters most.
Pull at least 30 days of flow data if you have it. Look for the peak hourly flow, not just peak daily. Drum filters respond to instantaneous hydraulic load. A unit sized for average flow will bypass or flood during peaks unless someone built in margin.
Municipal vs Industrial Flow Patterns
Municipal influent tends toward diurnal curves with predictable morning and evening peaks. Industrial discharge is messier. Food processing plants often dump high-solids wash water in short bursts. Design around the worst realistic hour, not the comfortable average. Vendors will happily agree to optimistic guarantees based on average flow because it makes their quote look smaller.
Step 2: Calculate Required Screen Area
Screen area calculation follows a simple formula once you have a reliable hydraulic loading rate: Required Area (m²) = Peak Hourly Flow (m³/h) ÷ Hydraulic Loading Rate (m³/m²/h). The loading rate itself depends on mesh size and solids characteristics, which is where experience matters more than the formula.
Finer mesh filters more solids per pass but accepts less flow per square meter. Coarser mesh moves more water but lets finer particles through. This tradeoff drives most disputes between sizing approaches. Choosing too fine a mesh for the flow rate forces a larger, more expensive drum than the application needs.
| Mesh Size | Typical Loading Rate | TSS Removal | Common Application |
|---|---|---|---|
| 20–40 micron | 60–100 m³/m²/h | 60–80% | Aquaculture, tertiary polish |
| 60–100 micron | 100–150 m³/m²/h | 50–70% | Municipal pre-treatment |
| 200 micron | 150–220 m³/m²/h | 40–55% | Food processing, FOG-heavy streams |
| 500 micron | 220–300 m³/m²/h | 30–45% | Coarse screening, fiber removal |
Applying the Safety Factor
Once you have the theoretical screen area, add a safety factor of 1.3 to 1.5x. This accounts for mesh blinding over time and seasonal solids variation. It also covers the gradual loss of effective open area as fine fibers and grease accumulate in the weave. Skipping this margin is the single most common cause of underperforming installations we’ve inspected.
Step 3: Select Mesh Size for the Application
Mesh selection should follow solids characterization, not assumption. Send a representative sample for particle size distribution analysis before finalizing the spec. Guessing mesh size from “what worked at another plant” ignores the fact that fiber length, density, and grease content vary significantly between sources.
For aquaculture recirculating systems, fine mesh in the 20–60 micron range typically matches fish solids and uneaten feed particles. Municipal pre-treatment ahead of biological processes generally works well with 60–100 micron, balancing removal efficiency against hydraulic capacity. Food processing applications with high fat content often need coarser mesh paired with upstream grease management, since fine mesh blinds quickly under FOG loading.
When Mesh Size Decisions Go Wrong
The most frequent mistake involves specifying mesh too fine in pursuit of removal percentage on paper. A 20 micron screen looks impressive on a spec sheet. In practice, it may blind within hours under heavy organic loading, forcing constant backwash cycles that defeat the purpose of automated filtration. Match mesh size to actual operating conditions, not to the best-case number from a brochure.
Step 4: Account for Drum Rotation and Submergence
Drum rotation speed and submergence depth interact with screen area to determine actual throughput. A variable frequency drive lets the rotation speed adjust to influent flow, which extends mesh life by reducing unnecessary cycling during low-flow periods. Fixed-speed drums waste energy and accelerate mesh wear when flow drops below design capacity.
Submergence depth, typically one-third to one-half of drum diameter, controls how much screen area is actively filtering at any moment. Deeper submergence increases instantaneous capacity but raises the risk of solids carryover if backwash timing isn’t tuned correctly. This is a commissioning adjustment, not a fixed design parameter, and it should be tested under real flow conditions rather than left at factory default.
Step 5: Plan for Backwash Water and Disposal
Drum filters typically consume 1–3% of treated flow as backwash water, which carries the removed solids to a collection trough or downstream dewatering step. This volume needs a destination in the plant’s overall water balance. Sending backwash directly back to the head of the plant without accounting for its solids load can create a recycling loop that inflates apparent influent loading.
Sizing the backwash collection and disposal path is often an afterthought in drum filter projects, treated as a minor detail after the main equipment spec is finalized. It deserves equal attention. Undersized backwash piping or collection troughs can bottleneck the entire filtration cycle regardless of how well the drum itself is sized.
Step 6: Compare Vendor Quotes on Equal Terms
Vendor quotes vary widely because sizing assumptions vary widely. One quote might be built on average flow with no safety factor. Another might include a 1.5x margin and a coarser mesh that actually fits your solids profile better. Comparing prices without comparing underlying assumptions leads to false economy.
Ask every vendor for their assumed peak hourly flow, mesh size, and safety factor in writing. This forces an apples-to-apples comparison and exposes quotes that look cheap only because they’re undersized. A unit that requires replacement within two years isn’t actually the lower-cost option, even if the initial number was smaller.
Documentation to Request
Beyond the basic sizing numbers, request the manufacturer’s mesh blinding test data if available, expected mesh replacement interval, and a reference installation with a similar solids profile to yours. This documentation separates vendors who engineered the spec from those who quoted off a generic template.
Frequently Asked Questions
Sizing and Mesh Selection
How do I calculate the right screen area for my flow?
Divide your peak hourly flow by the hydraulic loading rate for your chosen mesh size, then apply a safety factor of 1.3 to 1.5x. This gives the minimum screen area to specify, accounting for mesh degradation and flow variability over the unit’s service life.
What mesh size should I choose if I don’t have solids data?
Start one size coarser than your target removal rate suggests, then commission with monitoring to confirm performance before committing to a finer mesh. Send a solids sample for particle size analysis whenever possible rather than guessing from similar installations.
Does finer mesh always mean better treatment?
No. Finer mesh increases removal percentage but reduces hydraulic capacity and blinds faster under heavy organic or fat loading. The right mesh size balances removal target against realistic operating conditions, not just the best-case number on a spec sheet.
Operation and Vendor Comparison
How much safety margin should I build into the sizing?
A 1.3 to 1.5x safety factor on screen area is standard practice for accounting for mesh blinding, seasonal variation, and gradual capacity loss over time. Skipping this margin is the most common cause of underperforming drum filter installations.
Why do vendor quotes vary so much for the same flow rate?
Different vendors assume different peak flows, mesh sizes, and safety factors, which produces very different unit sizes and prices for what appears to be the same project. Always request these assumptions in writing before comparing quotes.
Need help sizing a drum filter for your specific flow and solids profile? Our engineering team reviews flow data and solids characterization before recommending equipment, not after.
Contact Morvolous Engineering Team for a sizing review.